GPU Cloud Economics: What a GPU-Hour Really Costs
H100 rental prices went up in 2026, not down. A bottoms-up model of $/GPU-hr for a GB200 build, CoreWeave's P&L as a case study in depreciation and interest, and why $2.50 vs $3.50 is the line between a dud and a deal.
The 2025 consensus was that GPU-hour prices would keep sliding as Blackwell shipped and Hopper aged. That's not what happened. H100 contract prices went up in 2026, neoclouds raised tens of billions in debt, and the whole business turned into a question of financing. Here's how a GPU-hour actually pencils out.
TL;DR
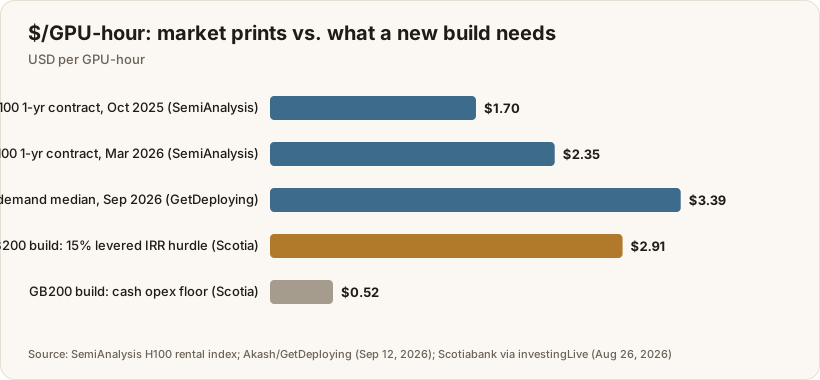
- SemiAnalysis's H100 one-year contract index went from ~$1.70/hr (Oct 2025) to ~$2.35/hr (Mar 2026), about +40%, as capacity sold out (SemiAnalysis). The GetDeploying on-demand median was ~$3.39 in mid-September (Akash / GetDeploying).
- Scotiabank's model of a 100 MW GB200 NVL72 campus costs $40.3M per MW all-in and needs ~$2.91/GPU-hr for a 15% levered equity IRR. Cash opex is only ~$0.52/hr (Scotiabank via investingLive).
- At CoreWeave in 2Q26, depreciation ate 54% of revenue and interest another 25% (CoreWeave 2Q26). This is a capital-recovery business wearing a cloud costume.
The market: prices went up
The Akash/GetDeploying tracker shows how spread out "the price of an H100" really is. In September it ranged from ~$2 to ~$12 per GPU-hour on demand: specialist clouds at $2–4, AWS P5 around $6.88, Azure's 8-GPU ND H100 v5 around $12.29 (Akash, Sep 12 2026). Spot and multi-year reserved run about half of on-demand.
The direction matters more than the spread, though. Hopper was supposed to fade. Instead, contract rates rose ~40% in five months because on-demand capacity sold out and anyone holding reservations kept them. When the previous-generation GPU gets more expensive, demand is outrunning deployable supply, and that's mostly a power and memory story (see HBM).
Bottoms-up: what a GB200 GPU-hour costs to make
Scotiabank's August deep dive is the cleanest public model I've seen (summary):
- Total capex: $4.03B for 100 MW of critical IT, i.e. $40.3M/MW
- IT equipment (64%) at $3.0M per NVL72 rack; facility (36%) at $14.5M/MW
- Financing: 70% debt at 8.0% over six years, 15% residual value on IT
- Output: ~$2.91/GPU-hr for a 15% levered equity IRR; cash opex floor ~$0.52/hr
I backed out a simple unlevered version to see where the $2.91 comes from:
| Step | Value |
|---|---|
| IT capex: 64% × $4.03B | ~$2.58B |
| ÷ $3.0M per rack | ~860 racks → ~61,900 GPUs |
| All-in capex per GPU | ~$65K |
| Annual capital recovery (6 yrs @ 8%, CRF ≈ 0.216) | ~$14.1K/GPU/yr |
| Per GPU-hour at 100% / 80% utilization | $1.61 / $2.01 |
| + cash opex (Scotia) | +$0.52 |
| Breakeven-ish at 80% utilization | ~$2.53/hr |
So at an 8% cost of capital and 80% utilization, a GB200 GPU-hour costs about $2.50 to produce. Equity returns are everything above that. Which is why Scotia's own line is the one to remember: "the difference between $2.50 and $3.50 separates a failed base case from a project that clears both return and coverage tests."
Sensitivities that move the answer the most:
- Useful life. Six years is the industry standard (CoreWeave depreciates computing equipment straight-line over six years, per its 10-Q). Cut it to four and capital recovery per hour goes up ~40%.
- Utilization. Every 10 points of utilization moves capital recovery by roughly $0.20–0.30/hr at this capex level.
- Cost of debt. Neocloud debt priced well above 8% makes it a whole different project.
- Residual value. What's a GB200 worth in 2032, after Rubin and its successor? Nobody knows, and the base case depends on it.
Case study: CoreWeave's P&L
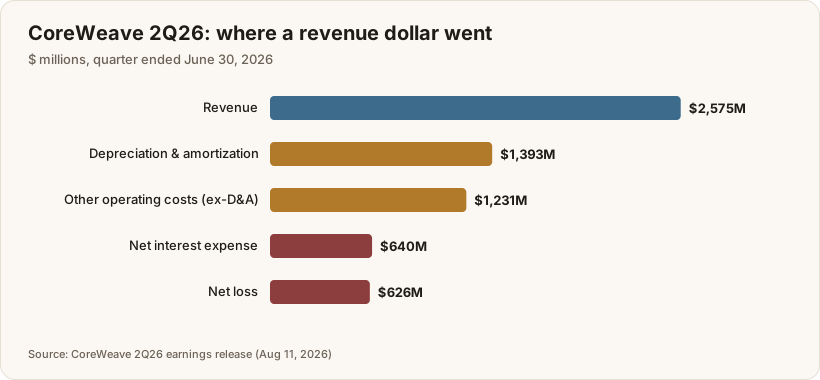
CoreWeave's 2Q26 numbers show the structure clearly (release):
| $M, 2Q26 | Value | % of revenue |
|---|---|---|
| Revenue | 2,575 | 100% |
| Adjusted EBITDA | 1,510 | 59% |
| Depreciation & amortization | 1,393 | 54% |
| GAAP operating income | (49) | (2%) |
| Net interest expense | (640) | (25%) |
| Net loss | (626) | (24%) |
| Capex (cash PP&E purchases) | 6,422 | |
| Revenue backlog | ~104,000 |
Read it like a credit analyst would. A 59% EBITDA margin looks like a great software business. Then depreciation takes 54 points and interest takes another 25. The equity story is backlog (~$104B, plus $25B+ added in early Q3) turning into revenue faster than the debt costs accrue, with active power growing from ~1.0 GW to 1.5 GW in the quarter and 3.7 GW contracted.
That isn't a criticism, just the model. GPU clouds are infrastructure lessors. They win on cost of capital, speed to power, and utilization, the same way tower companies or aircraft lessors do.
How to use this
- Renting? Anything under ~$2.50/hr on a multi-year GB200 contract is probably below a new build's breakeven. Lock it in. Short-term on-demand above ~$4 is paying someone's equity IRR.
- Building? Your edge is cost of capital and time-to-power, not GPU pricing, because everyone pays roughly the same to NVIDIA.
- Investing? Watch contract pricing (SemiAnalysis index), useful-life policy, and interest coverage. The bear case is a tenant default hitting a single-purpose asset. Scotia compares it to fiber after 2001.
Bottom line
A GPU-hour is a financing product. The silicon is roughly a fixed cost everyone pays. What separates operators is the cost of money, how fast they get power, and how full they keep the racks. The 2026 price spike gave operators room, but the gap between $2.50 and $3.50 is the entire business.