Q3 Prints: The Capex Held, the Cash Didn't
Microsoft and Alphabet both undershot Q3 capex estimates, and neither cut demand. The real story is neocloud delivery slips, Alphabet's TPU inventory build, and a Q4 that has to be the biggest quarter of the cycle.
Tom Pechulis, , 5 min read
Ten days ago I wrote about the $730B capex question and said to watch two things in the Q3 prints: whether the H2 run-rate showed up, and how free cash flow held up. With Meta (Oct 21) and Microsoft and Alphabet (Oct 28) reported, we have the answer. The run-rate came in light, but not because anyone pulled back on demand. Capacity they paid for didn't show up on time. The cash picture got worse anyway.
TL;DR
- Both capex numbers missed. Microsoft: $45.2B vs ~$50.7B consensus. Alphabet: $51.4B vs ~$55.1B (CNBC, CNBC). Microsoft cut calendar 2026 to ~$170B from ~$175B, and the cut came from third-party GPU-as-a-Service deliveries slipping, not from lower demand.
- Cash got worse anyway. Alphabet FCF was −$9.1B and Meta's was −$2.1B. Microsoft printed +$18.6B and the market reacted accordingly: GOOGL was down ~12% Thursday morning while MSFT was roughly flat (Reuters).
- Q4 has to be huge. Backing out year-to-date spend from the guides, Alphabet needs $63–73B in Q4 and Meta $49–59B (my math). Microsoft guided >$50B.
What actually happened
| 3Q26 | Microsoft | Alphabet | Meta |
|---|---|---|---|
| Capex (company definition) | $45.2B | $51.4B | $34.9B |
| Consensus | $50.7B | $55.1B | — |
| Operating cash flow | $58.0B | $42.3B | $32.8B |
| Free cash flow | +$18.6B | −$9.1B | −$2.1B |
| Cloud growth | Azure +48% | Google Cloud +103% | — |
| 2026 capex guide | ~$170B (was ~$175B) | $195–205B (held) | $135–145B (low end up) |
Sources: Microsoft FY27 Q1 release and call; Alphabet 3Q26 release and call; Meta 3Q26 release. Microsoft capex includes $7.4B of finance leases; cash paid for PP&E was $39.4B.
Microsoft: the neocloud slip
Amy Hood's wording on the call is what matters for infra people: capex was $45.2B "as some third-party capacity deliveries we expected in Q1 were delayed," and Azure guidance has to offset "some 3P GPU-as-a-Service contracts that have been delayed to H2" (fiscal H2, meaning January–June 2027). She guided Q2 to over $50B and calendar 2026 to ~$170B "due to the 3P capacity delays." She still said demand exceeds supply (transcript).
She didn't name vendors, but Microsoft's GPUaaS bench includes CoreWeave, Nebius, and IREN, and all three traded down after the print (CNBC). This lowkey confirms what I flagged in GPU cloud economics: neocloud capacity is only as real as its power, memory, and financing. Right now, financing is the weak link. CNBC reports lenders pulling back from non-investment-grade builders as rates rise, and Gartner thinks 80% of neoclouds get absorbed or shut down by 2030.
Two more details:
- ~75% of capex went to short-lived assets (CPUs and GPUs, including memory and storage), up from ~50% a year ago (CNBC). Microsoft is buying things that earn revenue this year, not shells that earn it in 2029.
- Hood explicitly said H2 spending accelerates partly because of "higher memory and storage costs." That's the HBM/DRAM squeeze showing up as a capex line item for the second quarter in a row.
Alphabet: cooked on cash, not on demand
The Alphabet print looks bad until you split it apart. Google Cloud grew 103% to $30.7B at a 36.2% operating margin, and backlog rose to $561B. That isn't a demand problem. The cash problem has three parts:
- Capex of $51.4B against $42.3B of operating cash flow.
- TPU systems inventory. Alphabet now sells TPU systems for customer and third-party data centers, including the Oracle deal announced this week and one with Crux AI. Inventory went from $2.4B at year-end 2025 to $13.3B. Management says all of it is tied to signed contracts, with revenue ramping in 2027.
- A one-time $5.2B EC fine payment.
My math: excluding the EC fine, Q3 FCF is still roughly −$3.9B. So the fine made it look worse, but the quarter was negative without it.
How it's funded: the Q3 cash flow statement shows $29.0B of debt issued and $12.4B of common stock issued, and $0 in buybacks. Long-term debt is $125.1B. Off balance sheet, Alphabet disclosed $924B of purchase commitments and $152B of pre-commencement leases. Ashkenazi also said Google started using third-party bridging capacity at the very end of Q3, will ramp it in Q4 with "margin headwinds," and expects capex to "increase significantly in 2027."
The market's take was a W for Cloud and an L for the balance sheet. Thursday morning was on pace for the worst post-earnings move in GOOGL's history (CNBC).
The cash-coverage chart, updated
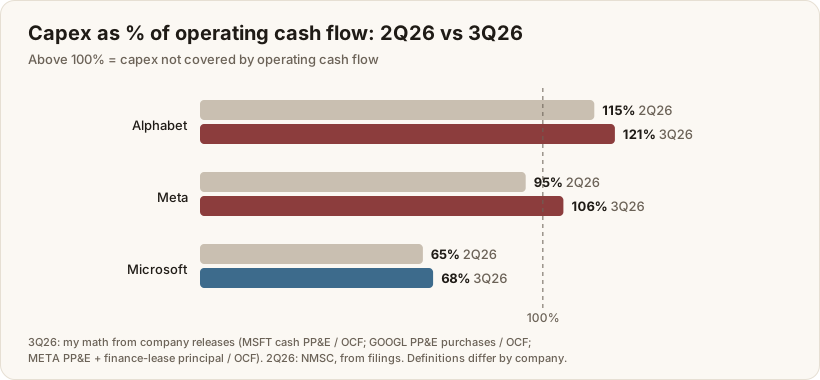
The 2Q26 bars are from NMSC. For 3Q26, I computed each company's own capex measure divided by operating cash flow: Alphabet ~121%, Meta ~106%, Microsoft ~68%. Meta crossed the 100% line this quarter. Microsoft is the only one of the three funding the build from operations with room to spare. That's why the discourse flipped this week from "who's spending the most" to "who can pay for it."
The Q4 math
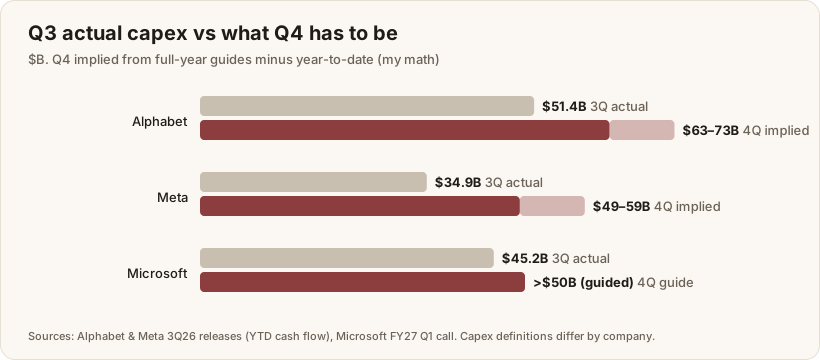
My math, from the year-to-date cash flow statements:
| $B | 2026 guide | 9M actual | Implied 4Q | 3Q actual |
|---|---|---|---|---|
| Alphabet | 195–205 | 132.0 | 63–73 | 51.4 |
| Meta | 135–145 | 85.8 | 49–59 | 34.9 |
| Microsoft | ~170 (CY) | — | >50 (guided) | 45.2 |
Meta's 9M figure is PP&E purchases ($83.1B) plus finance-lease principal ($2.8B). Alphabet's is PP&E purchases. Even at the low end, Alphabet needs Q4 capex ~23% above Q3, and Meta needs ~41% more. Microsoft is the only one guiding a modest step-up, and it already cut the year to get there.
Either Q4 is the biggest equipment-delivery quarter of the cycle, or someone lands at the bottom of their range (or below it) and blames supply. Since slips are already being disclosed, I'd lean toward the low end and more spend pushed into 1H27. Hood already said capex accelerates in the first half of 2027.
What this means for infra
- Demand isn't the constraint. Delivery is. Every CFO said supply-constrained. The misses came from third-party capacity, memory costs, and timing, not order cuts.
- Neoclouds are now the marginal swing supplier, and the market is pricing it. If you're buying GPU capacity from a non-investment-grade provider, ask about their financing as hard as you ask about their power. Oracle got paid Wednesday (+~11%) for promising to cap external financing (Reuters).
- Merchant TPUs are real. Inventory going from $2.4B to $13.3B, a system-sales line inside Cloud, and Oracle hosting TPUs from 2027 make Google a systems vendor now, not just a cloud.
- Next up: Amazon after the close today. It's the last big print. Watch AWS growth vs. the ~$220B guide, and whether Amazon also blames delivery slips.
Bottom line
This wasn't the capex rollover the bears wanted. Microsoft trimmed $5B because GPUaaS vendors couldn't deliver, and Alphabet held its guide while flagging a significantly bigger 2027. But the market now cares more about funding than spending. Cash-funded builders get rewarded; debt- and inventory-funded builders get punished, even with 100%+ cloud growth. Ngl, a Q4 that has to come in 23–41% above Q3 while neoclouds are slipping deliveries is the setup I'm watching most into year-end.